Published Wed 03 Nov 2021 04:47 by Technical Analyst
Fed interest rate decision
The Federal Open Market Committee (FOMC) members vote on where to set the rate. Traders watch interest rate changes closely as short-term interest rates are the primary factor in currency valuation.
The US interest rates have been set at 0.25% since March 2020 and have not been changed. The Federal Reserve plans to scale back its monthly bond purchases, which is used to stabilize the financial markets. This was to recover the US economy from the impact of the Covid-19 pandemic.
The plan is to slow down bond purchases from $120 billion to $15 billion per month. This will mean tapering will be completed by June 2022. This will be a critical factor in the setting of interest rates for 2022.
The interest rate might remain the same after this Wednesday’s meeting. However, the market will react to the tapering timeline, which might create a high level of volatility.
Fed interest rate decision is due Wednesday, 3 November 2021 at 20:00 GMT +2.
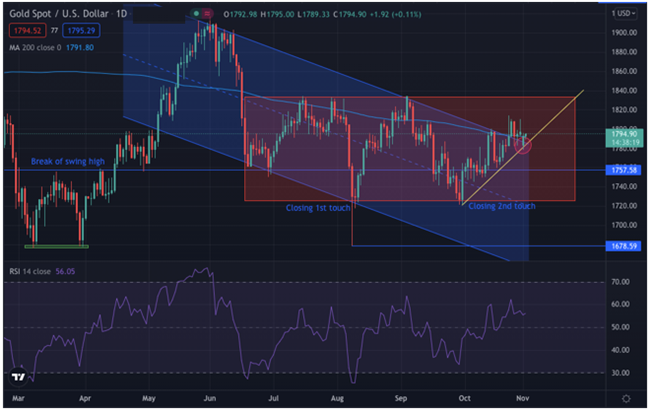
Gold Technical Analysis for the daily time frame
Analyzing the overall trend is the most crucial step in trading. Traders can use any strategy to do it. One of the best ways is to apply a 200 moving average in the chart.
Moving Average (MA)
The 200-moving average on the daily time frame was seen crossing the gold price in mid-May, moving up. Price since then has been in a range state. The moving average is holding above the price, meaning the market could be trading in a bearish move.
Relative Strength Index (RSI)
We are applying the RSI to see the overbought, oversold, and divergence. On a daily time frame, we do not see divergence formation when the price line on the RSI is rising and seen touching 60.
Technical Analysis using Price Action:
The price crossed the 200-moving average in mid-June, moving down, and kept trading below the MA. The XAUUSD price was making a bearish channel till now. In Aug, we could see a significant downfall till 1678.59; the price went down but the buyers made an entry and were able to close the candle at 1725.00.
The price then made a long-legged Doji and then moved up, making a lower swing high. Nevertheless, the price was not able to break the resistance of 1835. The price further made a double bottom and is now moving up by following the trend line.
Traders should wait for the price to break the range zone (red area). If the price break the range moving up, they can take BUY trades with a retest, and if the break is downwards, they can take a SELL trade.
Potential pivot points using Price Action:
Resistance Pivot
Support Pivot
R1
1802.14
S1
1784.84
R2
1808.47
S2
1773.87
R3
1819.44
S3
1767.54
This considerable resistance and support level can be used to enter or exit when approaching future market openings.
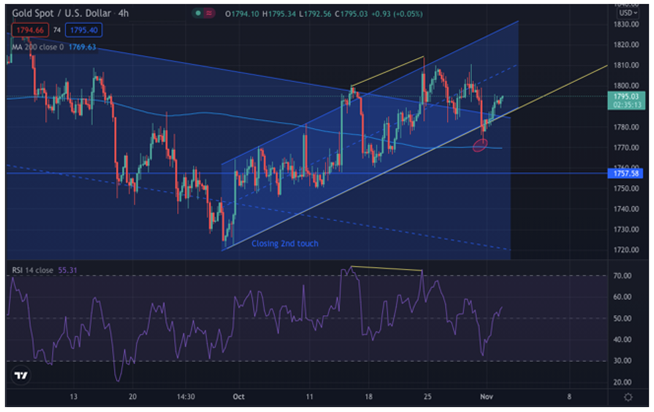
Gold Technical Analysis For The 4-Hour Time Frame
After analyzing the market trend on the higher time frame, we are looking at 4hr for market movement. Here we can see the RSI bearish divergence meaning the market could move down in the short term.
The price overall was following the bullish channel and also came down and touched the 200-moving moving average. If the price breaks the resistance at around 1813.00, traders can look for BUY opportunities, and if the price moves down, breaking the channel traders must wait for the retest and take a SELL trade.
Key Trading Recommendation
XAUUSD is a highly volatile market and having 100-120 pip movement during a news release is not a big deal.
Furthermore, the Fed’s interest rate decision will affect the USD currency. Every trader and investor has their eyes on it; waiting for the right move would always be the best risk management strategy.
Although a large number of traders would not place their trades before the news, you too can consider doing the same.