Retail sales measure the change in the total value of inflation-adjusted sales at the retail level. It is the foremost indicator of consumer spending, which accounts for the majority of overall economic activity.
The UK’s last retail sales figure was -0.9%, lower than the forecast of 0.5%. However, retail sales have improved since September. The August number was lower at -2.8%.
UK online food sales increased by 36.7% compared to the same period last year. Retail sales have improved; however, it is still down overall. The last number shows signs of recovery, with consumer’s shopping trends increasing closer to the Christmas season.
A better-than-expected number can be bullish for the GBP, and a lower-than-expected number could show the GBP declining.
UK Sales (MoM) report is due Friday, 22 October 2021 at 08:00 GMT +2.
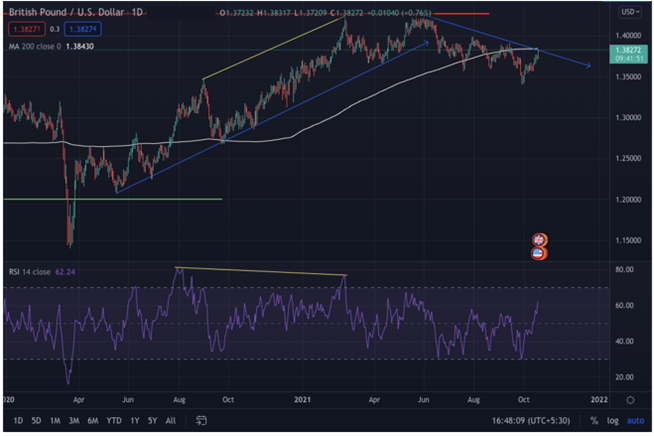
GBPUSD Technical Analysis for the daily time frame
Analyzing the overall trend is the most crucial step in trading. Traders can use any strategy to do it. One of the best ways is to apply a 200 moving average in the chart.
Moving Average (MA)
The 200-moving average on the daily time frame was seen below the market price until 20 July 21. After that, the price crossed the moving average showing the current short-term phase to be in a consolidation state. The market might be trading on the lower side soon according to the price pattern.
Relative Strength Index (RSI)
We are applying the RSI to see the overbought, oversold, and divergence. On the daily time frame, the RSI formed divergence, meaning the price action formed a higher high while the RSI formed lower highs. Also, the price was seen moving up and crossing the 60 zones.
Technical Analysis using Price Action:
Daily time frame has been used in the price action trading to look for the overall market trend. The overall market trend short term has been on the bullish side; however, the price tried to break the high at 1.42276 but was not able to and headed down. The market recently was seen making lower highs and lows. The recent low is at around 1.34103.
If the price breaks the low, then traders should follow the trend and try taking sell trades. Price moving down and the 200-moving average crossing the price from up moving down is an additional signal for a sell.
Potential pivot points using Price Action:
Resistance Pivot
Support Pivot
R1
1.3758
S1
1.3700
R2
1.3791
S2
1.3675
R3
1.3816
S3
1.3642
This considerable resistance and support level can be used to enter or exit when approaching future market openings.
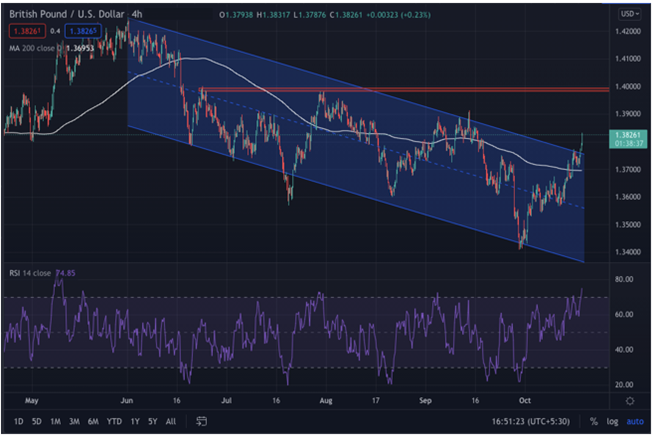
GBPUSD Technical Analysis For The 4-Hour Time Frame
Following the 4-hr time frame analysis, we can see the price was making lower highs and lower lows, meaning the market is heading down. We have a bearish pressure, but it does not seem to be for long as the price is also seen breaking the recent bearish channel.
The current breakout may be a false setup. Also, there is a nearby resistance level at around 1.39133. The major resistance zone to look at is around 1.40000. If the price comes down after touching the upper bearish trend line, the recent support zone will be around 1.35983.
Key Trading Recommendation
GBPUSD is a highly volatile market and having 80-90 pip movement during a news release is not a big deal.
Furthermore, the UK Retail Sales news release can affect the GBP currency, and every trader and investor has their eyes on it; waiting for the right move would always be the best risk management strategy.
Although a large number of traders would not place their trades before the news, you too can consider doing the same.