Published Wed 29 Sep 2021 00:20 by Technical Analyst
US Initial Jobless claims
Initial Jobless Claims measure the number of people filing for unemployment insurance, it Is reported weekly.
Last week’s reading was 351,000, which was less than expected. The Dow Jones estimates for this week was a lower number at 320,000.
Jobless claims increased last week, the highest it has been since August 2021. This means more people are filing for unemployment benefits which indicates a decrease in the labor market.
Continuing claims data, which runs a week behind, also increased, rising 181,000 to more than 2.84 million.
A higher-than-expected reading should be taken as negative/bearish for the USD, while a lower-than-expected reading should be taken as positive/bullish for the USD
Initial Jobless claims data is due Thursday 30 September, 14:30 GMT+2
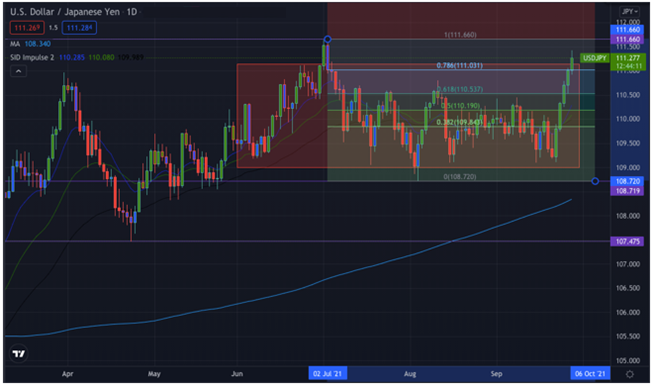
USDJPY Technical Analysis for the daily time frame
Analyzing the overall trend is the most crucial step in trading. Traders can use any strategy to do it. One of the best ways is to apply a 200 moving average in the chart.
Moving Average (MA)
Using the 200 moving average, you will be able to determine the overall market trend; On the chart, we can see that the daily time frame market is bullish. The price crossed the 200 moving average from below in Feb 2021. The price since then has been on the higher side and shows better opportunities for buys.
Technical Analysis using Price Action:
Using the top-down multi time frame for technical analysis, daily followed by 4hr and 30min for rejection and trade execution. Price action will give more clarity to the overall market scenario.
Overall, the market is bullish, meaning the traders should look into the buying opportunities until the break of any significant swing low or support zone. As we can see the price was moving in between the red zone meaning the price was ranging.
The Fibonacci level at 111.660 shows a new solid resistance zone. The zone 110.500 can be a good support zone for a retest. The price was seen rising significantly. The overall market seems reasonable, but on the bullish side, the initial jobless claims news could be a key contributor to the market direction.
Potential pivot points using Price Action:
First resistance point is 111.75
Second resistance point is 111.41
Third resistance point is 111.21
First support point is 110.67
Second support point is 110.33
Third support point is 110.12
This considerable resistance and support level should be used as an entry or exit point trading point when approaching future market openings.
USDJPY Technical Analysis For The 4-Hour Time Frame
In the 4hr time frame, the price broker the short-term bearish trendline; at the same time, the price also broke the 200 moving average moving up, showing an excellent buying opportunity.
The price also made a double bottom on 4hr time frame and broke the new high at 109.703; you can see the market shoot up after the price broke the trendline and the moving average.
This here was three confluence. The price is also nicely seen following the trend line moving up. There is a good buying opportunity in the current pullback.
The resistance price of 111.660 is the first one to look out for; if the price breaks it, keep looking to 112.244.
The support price to look out for is 110.500 and further down at 109.618.
If you use indicators, you can match both the price action and the indicator for better confirmation.
Key Trading Recommendation
The US initial jobless claims news release can affect the USD currency, and every trader and investor have their eyes on it; waiting for the right move would always be the best risk management strategy. Although a large number of traders would not place their trades before the news, you too can consider doing the same